Overview
Expose the current state of services using a dashboard help guide teams’ actions to build a proactive initiative and change of posture on how to be more proactive.
Dashboards will help refine and improve the knowledge of how the service behaves. In the beginning will also improve refine alarms and conditions and what data need to be enriched to be added on internal services requests.
Every visualization needs to have an objective and guide to another step to improve the efficiency of troubleshooting.
Bellow we have the following categories direct correlated with an dashboard.
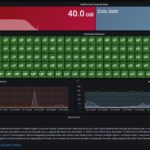
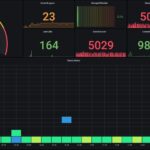
Main Dashboard – Objective of a main dashboards is put evidence an issue that can cause major impact as a Cloud Service here network is a key service to availability for this reason services like VPN, FastConnect are very relevant. Also, another details like packages that was throttle due instance shape can also indicate fine control. Also add instance health for production and improve the visualization details.
Environment – An application or service can have more than on relevant environment rather than production. Reflect this can be also necessary. With relevant services with an aggregated view of consumption of resources. Objective here is expose outliers.
Service Categories – Architect on Cloud is a composition of services expose those services used and how they interconnect is a major key here we have:
· OKE – Objective here is expose node and pod states.
· Autonomous Database Shared– Objective here is exposing the database service details with also the distribution of outlier’s queries that can be investigated by a DBA.
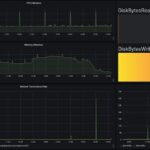
· Compute Instance – Objective is exposing all details of a compute instance, CPU, Memory, IO and network overtime time and instant metrics.
· Object Storage – Objective is expose what buckets are more consumed even in number of objects, size of sum data in each bucket and API errors.
· File Storage – Objective here is expose size of each File Storage, read and write latencies + Throughput
This OCI Dashboards can be found on this Grafana Labs link.


